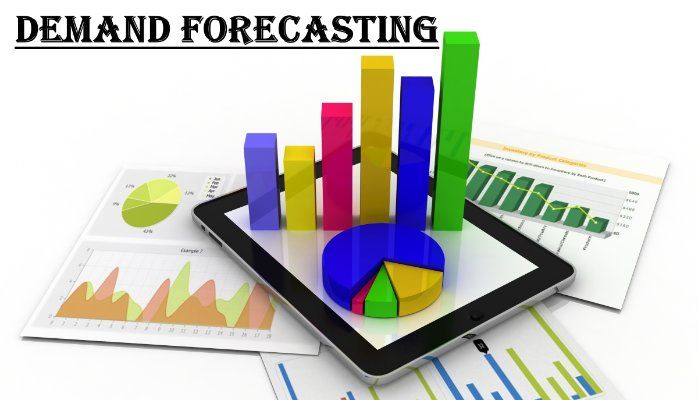
Frequent change in consumer demand and trending pattern of products that decision should be taken on careful analysis of data. Prediction of sales from previous sales data and estimated data is possible via the Demand Forecasting concept and its techniques.
Steps in the forecasting of demand are followed to promote a systematic calculation of potential demand for the product:
-
-
- Identifying the objective
- Determining the Time Outlook
- Choice of an appropriate type for forecasting method
- Collection of data and modification of data
- Estimate and Analysis of Performance
-
Types of Forecasting:
1. Qualitative /survey method: based on judgements, opinions, emotions, intuitions.
-
-
- Consumer survey
- Opinion poll techniques
-
2. Quantitative/ Statistical method: based on mathematical models and relies heavily on mathematical calculations
-
-
- Trend Projection techniques
- Barometric techniques
- Econometric techniques
-

Trend Projection Techniques:
1. Graphical method: Previous data points are projected on graphs and straight lines are drawn through the points to find outliers. This is a simple and inexpensive method but is not very reliable.
2. Fitting Trend Equation or Least Square Methods:
-
-
- Linear Trend: Time series data shows an upward or linear trend in revenue.
-
S= A+BT
Where S = annual sales; T = time (year); A and B are constants.
-
-
- Exponential Trend: The exponential pattern is used when data indicate that overall revenues have risen in recent years, either at a rising rate or at a constant rate per unit time.
-
3. Box-Jenkins Method: Box-Jenkins Method is another method of forecasting used for short-term forecasts and projections. This method is also used for stationary time-series sales results. Stationary time-series data is one that does not reveal a long-term trend.
Barometric techniques
The barometric method is based on the methodology of creating an index of specific economic indicators and forecasting future developments by analysing changes in these indicators.
- Leading series: includes indicators which move up or down of other series
- Coincidental series: includes indicators which move up or down simultaneously with other economic factors
- Lagging series: indicators which follow some time-lag
Econometric techniques
This method includes economic factors and statistical tools to find estimated sales.
1. Regression Method: Economic theory is used to determine the determinants of production and the nature of the relationship between the production of the commodity and its determinants. In this method, first is to decide the demand function. When defining the demand functions for a number of commodities, we may come across a number of commodities whose demand depends on a single independent variable or multiple. Then for single variable single regression demand function is used and for multiple, multi-variable demand function.
2. Simultaneous equation model: Multiple simultaneous equations are used to find out estimated demand for the product. These equations are usually found from behavioural database, market-clearing data and other mathematical identities.
Read more about :

