S curve is one of the most important concept when it comes to the Product Life Cycle (PLC) or the Product Evolutionary Cycle (PEC). It is a widely used concept in marketing. It is called the S curve because it looks like the letter S.
S curve is applicable to any business or startup where things move very slowly at first, then it gains momentum and continues to grow and finally a stage where productivity or sales declines and the market becomes saturated. S Curve equation enables one to know how large the sales will become and whether the sales have touched the inflection point.
Let’s have an overview of the S curve concept with an example. Once a company wanted to develop a product. It also wanted to forecast the sales and revenue generated by the product over the next few years. It took the help of a nonlinear graph called S curve to plot sales against the time period. Once assured that the product will be profitable for the company, it invested huge money on its research & development and finally launched the product in the market.
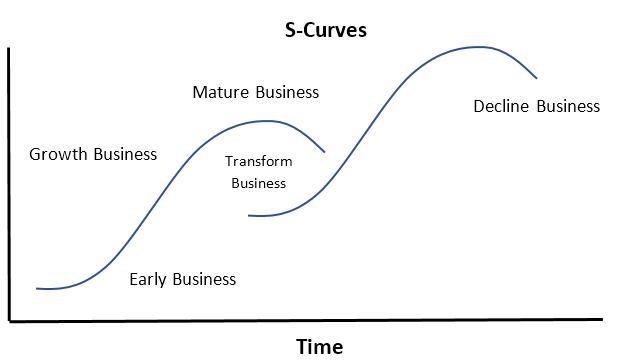
The S curve can be divided into 3 parts:
-
In the initial stage, the sales generated are less due to many factors like low demand, high competition in the market, poor promotion, and high costs associated with marketing.
-
Then the sales start to increase with an increasing rate up to a point( known as inflection point). This is due to greater public awareness and reduced costs due to economies of scale.
-
After the point of inflection, the growth rate of sales slows down. It means that only existing customers continue to buy and the product has reached its saturation point.
Once any product reaches its saturation point in its product life cycle, it can either die at this phase or if infused with new innovation and greater efficiency, it might create a newer S curve from this phase.
S curves are used to plan, control, analyze, and forecast the progress and performance of a product/project over a period of time. They are also used for cash flow forecasts, quantity output comparison, etc.