Last Updated on October 30, 2020 by Team TBH
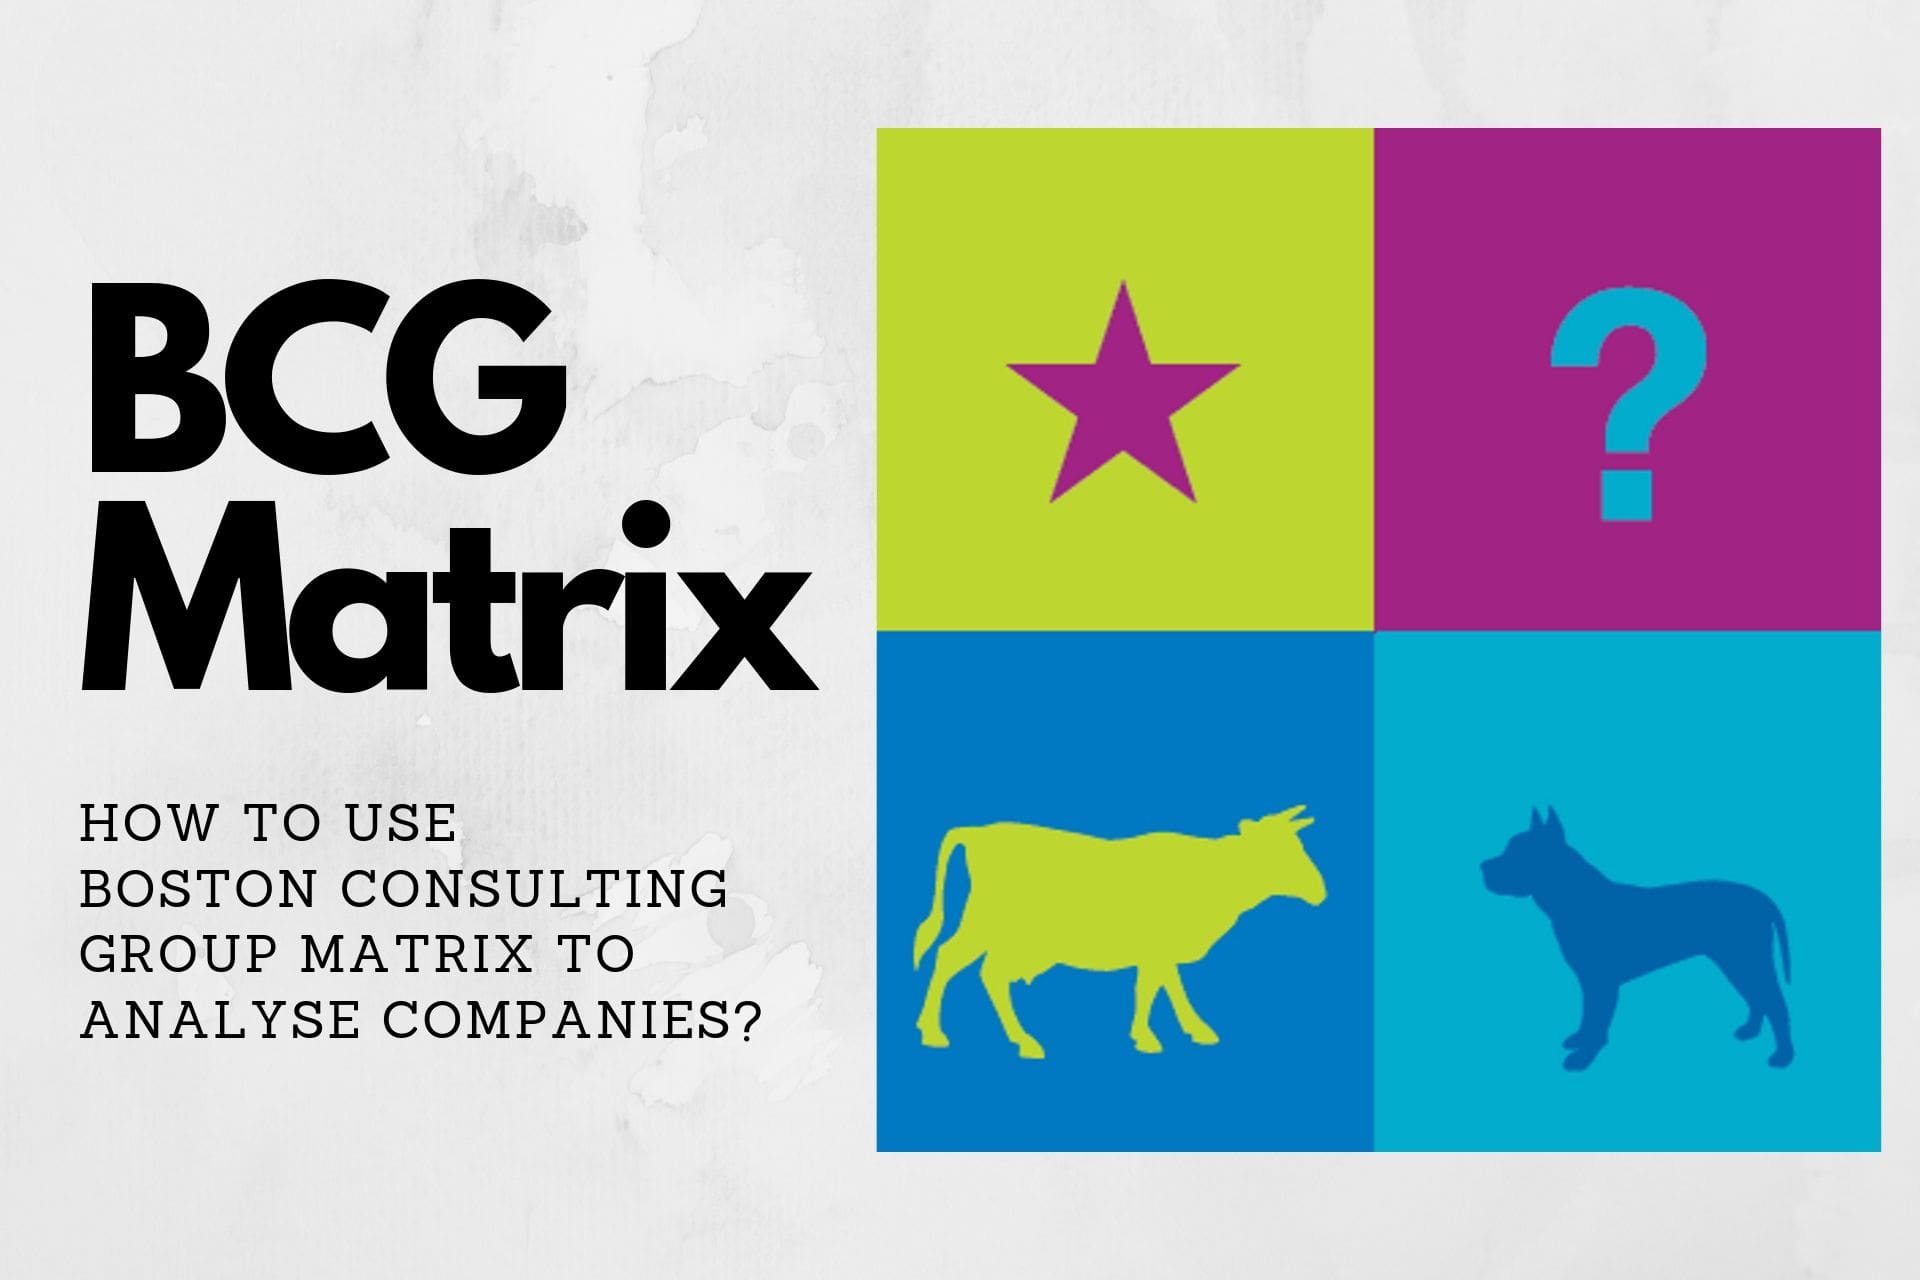
BCG is a firm by the name of Boston Consulting Group, which provides consulting services to various businesses. They have devised a matrix, the growth share matrix, which helps the company to carry out portfolio analysis. By this matrix, the company can decide whether to invest in products or stop producing the product. BCG matrix uses a relative market share of a firm in an industry and market growth.
There are two parameters of this matrix, market growth rate and relative market share. On the vertical axis, one has to plot market growth rate, and on the horizontal axis, plot the relative market share with high and low as sub-parameters.
Relative market share: It defines the company’s market share in relation to its largest competitor’s share. It is responsible for higher or lower cash returns.
Market growth rate: It is the rate at which an industry grows in the market. It is responsible for higher or lower cash usage.
Based on the above two parameters, the matrix is divided into four quadrants, namely, Star, Question mark, Cash cow, and Dog.
What are they?
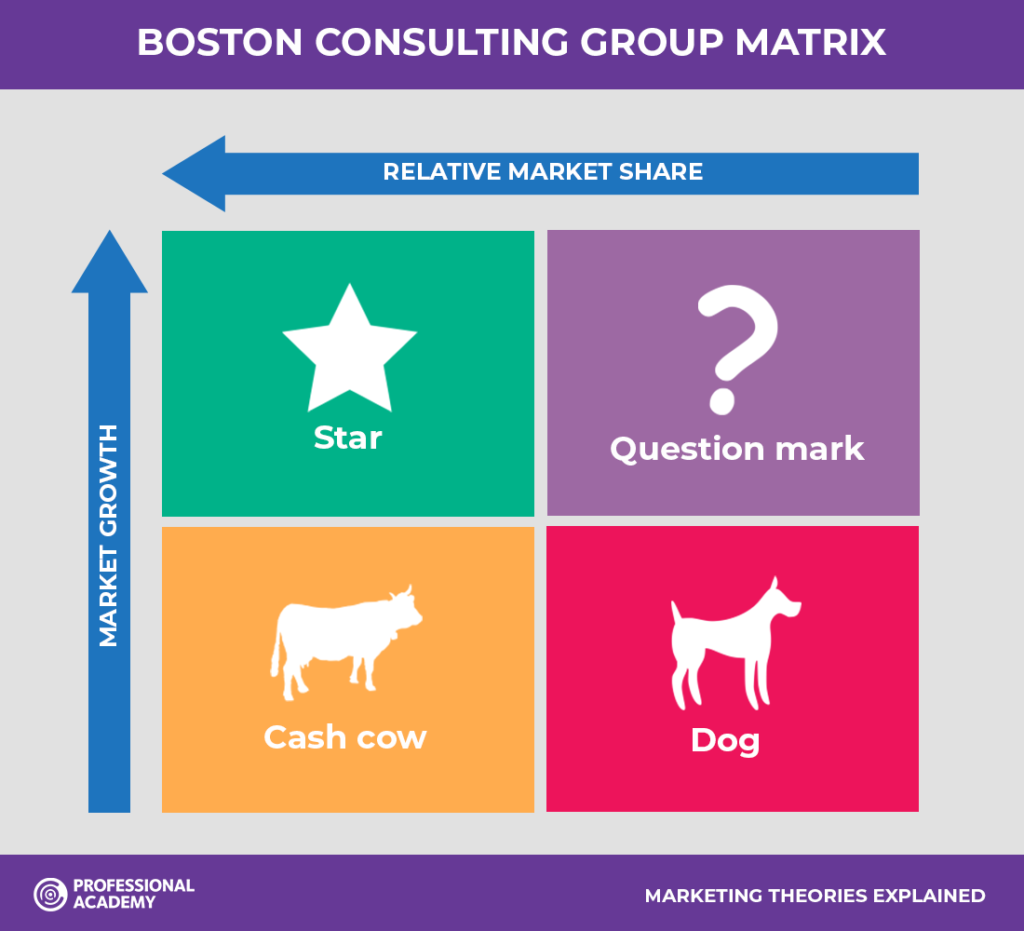
Star: Products in high growth markets with high market shares. It is the best performer product for the company. It uses high cash and generates high revenue.
Question mark/ Problem child: Products in high growth markets with low market shares. It uses high cash and generates low revenue.
Dog: Products in low growth markets with low market shares. It uses low cash and generates low revenue.
Cash cow: Products in low growth markets with high market shares. It uses low cash and generates high cash revenue.
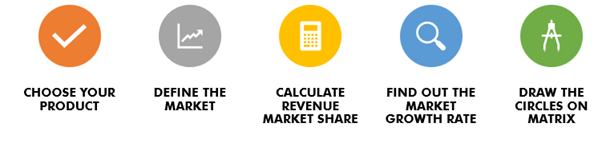
How to use this matrix?
To apply this matrix to the company’s product portfolio, follow the below steps:
How to analyze it?
Based on each of these quadrants, here are some recommendations:
Dog Products: They are a drain on the resource, so it is better to divest these products. It is recommended to remove any dogs from your product portfolio.
Question mark Products: It is not known if these products will become a star or drop into the dog quadrant. These products often require notable investment to drive them into the star quadrant. The difficulty is that a lot of investment may be needed to get a return. So, it is recommended to analyse your question mark products before making any investment.
Star Products: These products are the market head as they generate more ROI than other products. They require ongoing investment to sustain. So, it is recommended to hold these products.
Cash cow Products: The simple law here is to ‘Milk these products as much as possible without killing the cow!’. These are well-established products. So, it is recommended to harvest these products.
Let us understand it with an example.
Let’s take the example of Apple company. Apple has four products, namely, the iPod, iPad, MacBook, and iPhone.
- iPod is a dog product as neither market nor industry is growing for iPod.
- MacBook is a question mark product as the laptop industry is growing, but MacBook share has not increased much.
- iPad comes under the cash cow product as market growth for this industry is low, but iPad share is high in the market.
- iPhone is the company’s star product as the smartphone industry is growing, and iPhone share is high in the market.
As per the analysis done using the BCG matrix, it is recommended to get rid of the iPod, use the iPad as much as possible, use the iPad’s cash revenue in MacBook and continue to invest in the iPhone.