

Last Updated on August 18, 2026 by Team TBH
A branded study becomes a media product when people can use it before they encounter a sales message. The subject must answer a recognizable question, the method must be understandable, and the findings must travel well across formats without losing their meaning. A survey, price comparison, or data analysis that exists only to manufacture headlines may attract attention briefly, but it gives editors and readers little reason to return. The stronger test is whether the research can stand alone and still create an honest path back to the business behind it.
That standard needs to be set before data collection begins. The Content Marketing Institute’s research-planning questions ask teams to define the audience objective, available expertise, intended formats, and distribution plan in advance. They also stress the practical demands of sampling, questionnaire design, analysis, and reporting. These are editorial decisions as much as technical ones. A weak objective cannot be rescued by polished charts, while a sound method can still be wasted if the final result answers no useful question.
Score the Study Before Commissioning It
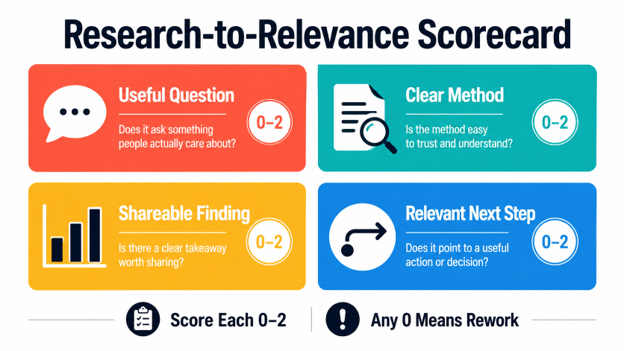
A simple Research-to-Relevance Scorecard can expose those weaknesses early. Give each criterion 0, 1, or 2 points. “Useful question” asks whether the study addresses a real uncertainty. “Clear method” tests whether a non-specialist can see where the data came from. “Shareable finding” considers whether the result can be summarized accurately in a headline, chart, or short paragraph. The final criterion, “Relevant next step,” asks whether the next commercial step continues the same subject.
A total of 7 or 8 signals a strong foundation. A middling score identifies a repairable weakness, while any 0 should pause commissioning because the presentation cannot compensate for an irrelevant question, an opaque method, an unusable finding, or a forced product connection.
Connect the Study to the Core Offer
Product adjacency is strongest when the research creates curiosity that the company’s actual offer can answer. Consider somebody who is looking to understand more about what attending a match and eating out in a strange city might cost them. They may research this online and come across a brand such as Bovada. They’ll read Bovada’s information on takeout expenses, and then potentially broaden their view to look at the other offerings this platform has.
In this case, the site also provides casino games, which are a relevant interest for somebody doing this kind of research: they’re likely to want a relaxing activity that they can enjoy at their hotel after the match, while they tuck into their takeout meal. That means the research is useful, and the link to the brand is strong, ticking the boxes we looked at earlier. They are likely to check out the latest games at Bovada Casino to see what is on offer in the same entertainment context.
They will find categories for New Games, Slots, Table Games, Blackjack Games, and Roulette Games, meaning that there is plenty on offer for varied individuals. The connection would be weaker if the study claimed to prove product quality, or if its findings were interrupted by unrelated promotional language. A useful transfer test is simple: remove the company name from the study, then ask whether the audience question still makes sense and whether the product page answers a natural follow-up.
Turn One Finding into Several Useful Formats
Shareability does not mean reducing a study to its most dramatic number. It means identifying the smallest accurate unit that can travel. A city comparison might become a ranked chart, a short explanation of the widest price gap, or a regional pattern story.
This is where distribution planning becomes part of research design. A methodology page supports scrutiny. A concise article explains the central finding. A graphic helps readers compare values quickly. A social post can point to one result without pretending to contain the whole study. To that point, this article on reusing one core idea across useful formats makes a similar distinction: changing the format should also change the function, rather than reproducing the same material repeatedly.
Interactive presentation can add involvement, but it should not be confused with credibility. A 2026 experiment compared an interactive data story with a non-interactive video version among 60 participants. The interactive version produced stronger emotional engagement, while effects on perceived trustworthiness were more limited and depended on context. For branded research, that means filters, calculators, and interactive charts may help people participate in a finding, but transparent sources and clear calculation logic still carry the evidential burden.
A study is ready to become a media product when all four scorecard criteria support one another. A useful question gives the work a reason to exist. A visible method makes it examinable. Shareable findings let it move between formats without distortion. Product adjacency creates a relevant next step without turning the data into a disguised advertisement. If one criterion scores poorly, the right response is to repair the study before publication, not to compensate with louder presentation.
To read more content like this, explore The Brand Hopper
Subscribe to our newsletter