Last Updated on November 16, 2026 by Team TBH
More posts, more likes, but less engagement per post. Would I call that a successful month? Not without checking the numbers. When I prepare an Instagram engagement report, I want to know what actually changed, not just which metrics increased. I use Engagement Rate Calculator to check follower-based rates and organize the findings into a monthly report the team can use to plan its next moves. Here’s how I build that report from start to finish.
Set Report Objective and Audience
My first question is who’s reading the report and what decision they need to make. A social media manager needs enough detail to adjust the content calendar. A marketing director is more interested in whether Instagram contributes to broader business goals. Sending both the same collection of numbers isn’t especially useful. I choose one main objective and build the report around it.
| Reporting goal | Question I want to answer | Metrics I’d prioritize |
| Improve engagement | Which posts consistently attract interactions? | Engagement rate, comments, saves |
| Increase visibility | Is content reaching more people? | Reach, views, follower growth |
| Drive website traffic | Is Instagram bringing visitors to the website? | Tracked website sessions |
| Improve content strategy | Which formats deserve more attention? | Performance by format, posting frequency |
At the top, I include the account name, reporting period, data collection date, and report owner. This makes the figures easier to review later or hand over to another team member.
Choose Metrics and Data Sources
One reporting mistake I avoid is combining numbers from several dashboards without identifying their sources. An Instagram metrics report may include native Instagram data, website analytics, and CRM records. Each system measures different activities.
For an account I manage, I use authorized Instagram Insights. For someone else’s public account, I limit the analysis to information that’s actually visible.
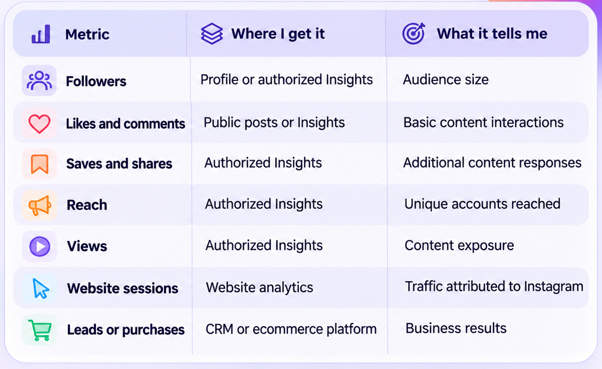
I select metrics according to the reporting objective rather than including every available figure. Before comparing results, I check what each metric measures. Reach counts unique accounts, while views may include repeated displays or plays. A profile visit isn’t the same as a website session.
Meta’s Social Content Measurement Framework offers additional background on selecting metrics according to content objectives. I also record the source and collection date for each dataset. Instagram interactions can continue accumulating after publication, so figures collected on different dates may not match.
Calculate Engagement Rate Consistently
For follower-based engagement rate tracking, I use:
Engagement rate = (Likes + Comments) ÷ Followers × 100
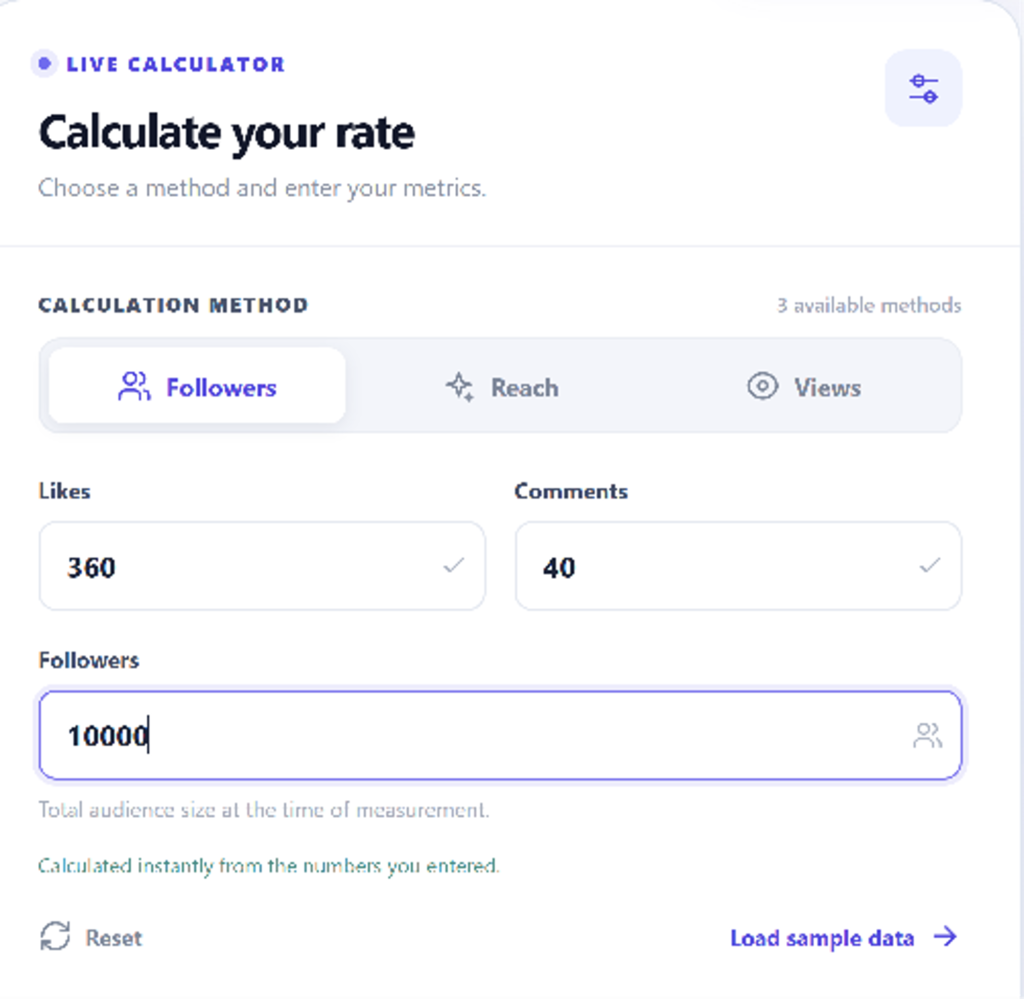
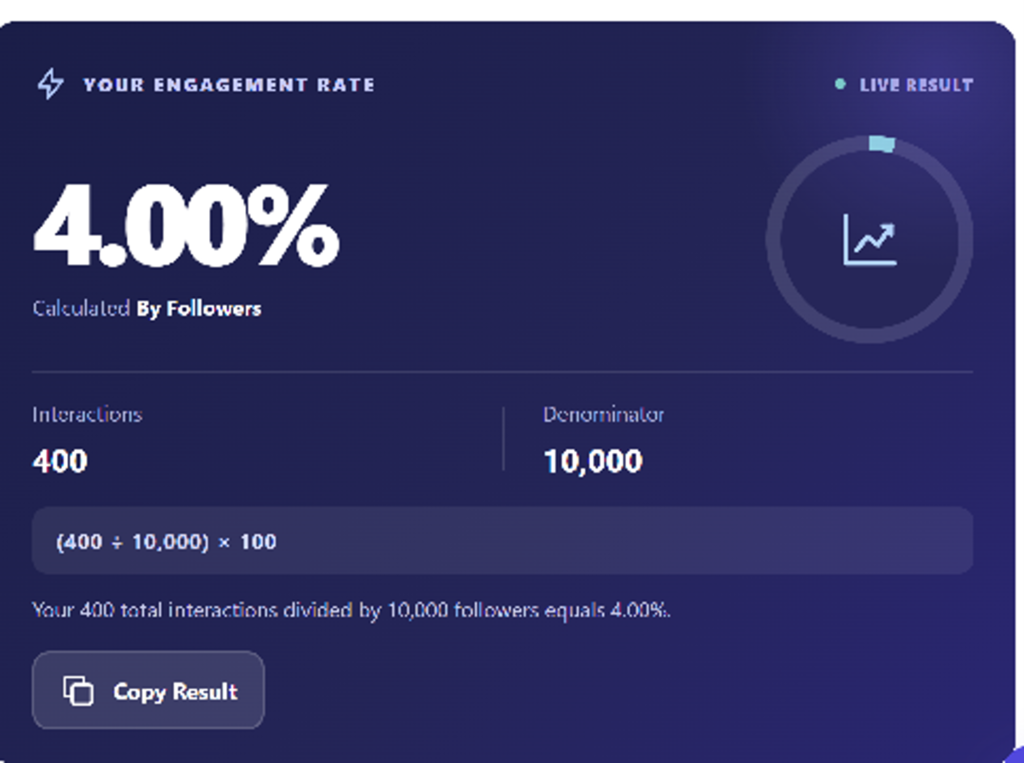
A post with 360 likes, 40 comments, and 10,000 followers has an engagement rate of:
(360 + 40) ÷ 10,000 × 100 = 4.00%
For an account with authorized Insights, I can also calculate engagement relative to reach. But I don’t compare follower-based and reach-based percentages directly. In my methodology notes, I record three details:
- Interactions: Which actions are included?
- Denominator: Followers or reach?
- Summary method: Median post rate, average post rate, or combined rate?
For monthly reviews, I prefer the median of individual post engagement rates when describing typical performance. One unusually successful Reel can push the average upward. I also record which follower count was used, especially when historical figures aren’t available. This keeps the calculations reproducible when preparing the next report.
Track Changes With the Same Windows
I compare complete months using the same metrics and calculation methods. I also check posting frequency, since more content can increase total interactions without improving engagement per post.
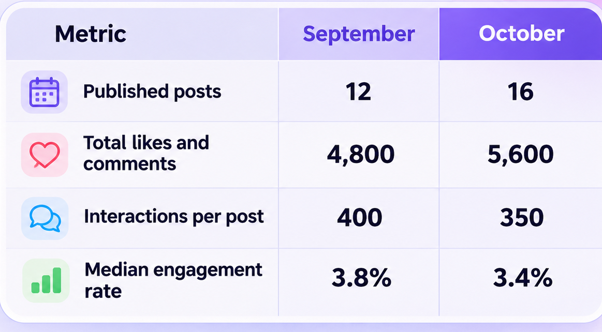
Total interactions rose by 16.7%, but interactions per post fell by 12.5%. I would report both changes without claiming that posting more caused the decline. Content formats, topics, and distribution may also have influenced performance. I also compare posts at similar ages. For example, I can record engagement seven days after publication rather than comparing new posts with older ones.
Build a One-Page Reporting Table
I keep my monthly Instagram report simple: key metrics, changes from the previous month, and a clear next action. Detailed post data stays in a separate spreadsheet tab.
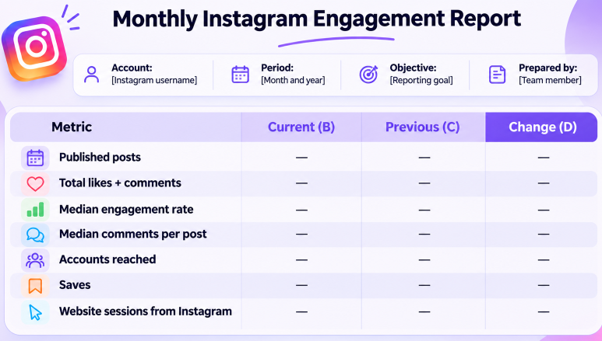
Below the table, I add three notes:
- Main finding: What changed most?
- Next action: What should the team review or improve?
- Owner and review date: Who will handle it, and when?
I remove irrelevant metrics and mark unavailable data as N/A, not zero.
Spreadsheet Fields and Formula Notes
In a separate tab, I record each post’s URL, publication date, format, followers, likes, comments, engagement rate, and data collection date. For the summary table, I use these formulas:
| Calculation | Excel / Google Sheets formula |
| Month-over-month change | =(B2-C2)/C2 |
| Engagement rate difference | =B4-C4 |
| Median post engagement rate | =MEDIAN(K2:K13) |
The first formula calculates relative percentage change, assuming row 1 contains headers. The second calculates the difference between engagement rates in percentage points (pp). The third calculates the median of the engagement rates stored in cells K2:K13.
I format results as percentages, label percentage-point differences clearly, and use N/A when the previous value is zero or unavailable. I adjust cell ranges to match the actual data.
Interpret Changes Carefully
Before interpreting monthly results, I check three factors that can affect engagement:
- Content format: I compare Reels, carousels, and images separately. A viral Reel can raise overall engagement without reflecting typical post performance.
- Paid activity: Boosted posts receive additional exposure, so I distinguish paid results from organic engagement.
- Seasonality: Holidays, giveaways, and product launches can influence audience behavior. I note these events when comparing monthly results.
For example, if median comments per post increased from 12 to 18 during a month with more question-led captions, I’d review similar posts before linking the increase to that change. I also check website traffic and conversions when reporting business results. Higher engagement doesn’t necessarily mean more customers.
Plan Next Month’s Tests
I finish the report with two or three practical changes the team can make in its next content calendar.
| Reporting finding | What I’d do next | Metric to monitor |
| Educational carousels receive more saves | Plan additional carousels on related topics | Median saves per carousel |
| Question-led captions attract more comments | Include relevant questions in upcoming posts | Median comments per post |
| Reels receive views but little discussion | Improve captions and discussion prompts | Median comments per Reel |
For each action, I record the current performance, the person responsible, and the review date. At the following monthly meeting, I compare the new figures with the baseline and decide which approaches to continue, adjust, or discontinue. Over time, these notes provide a record of content changes and the results that followed.
Check Engagement Rates Before Reporting
Use Engagement Rate Calculator when preparing follower-based calculations from your available reporting figures.
Calculate Engagement Rate
Make Monthly Instagram Reports Useful
I want every monthly report to answer three questions: What changed? What matters? What should we do next? A clear performance summary, consistent metrics, and assigned next steps make it easier to turn reporting into better content decisions.
To read more content like this, explore The Brand Hopper
Subscribe to our newsletter