

Last Updated on October 22, 2026 by Team TBH
A brand campaign can coincide with rising store sales and still leave a retailer unsure whether to expand it. The decision needs a credible estimate of additional demand, the cost of creating it and a clear account of what the test cannot establish.
That is a useful starting point for retail analytics consulting: define the rollout decision before choosing a reporting tool. A campaign report should help a marketing director decide whether to repeat, revise or stop a campaign, rather than simply present sales alongside advertising spend.
Consider Linden Lane, a fictional homewares retailer testing a local brand campaign. Every figure below is an illustrative assumption in US dollars, not a client result or an industry benchmark. The example follows store sales; it does not claim to measure the campaign’s full effect on brand awareness or future demand.
What You Will Learn
- How can comparison stores help separate a campaign from general sales growth?
- Which costs can change a campaign rollout decision?
- What can a short campaign test leave unanswered?
Define the Comparison Before the Campaign Starts
Choose the outcome, stores and observation window in advance. Here the outcome is net merchandise sales after discounts and refunds, excluding sales tax, across the same stores in two equal four-week periods. Returns are assigned consistently to their original sales periods after allowing the same time for refunds to emerge. That definition prevents an apparent improvement caused by changing the accounting boundary.
Select comparison stores with similar trading patterns, formats and catchments. Where practical, randomly assign suitable stores or geographic areas to receive the campaign, keeping the others as a comparison. NIST’s guidance on randomized designs explains the principle: randomly assign the conditions being tested to the experimental units. Geography also creates practical difficulties: customers and media exposure can cross the boundary between groups.
If assignment is not random, document why each store was chosen. Stronger stores selected by the marketing team may have grown faster without the campaign. Review several earlier periods, planned promotions, stock availability and local events. Similar past trends support a comparison but cannot prove that the groups would have continued moving together. A brief for Power BI consulting for retail should name the stores, dates and exclusions before the test.
Separate the Campaign Estimate From General Growth
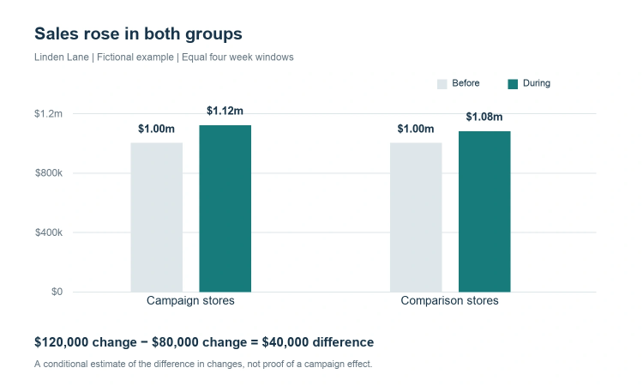
Linden Lane’s campaign stores generate $1,000,000 before the campaign and $1,120,000 during it. Comparison stores move from $1,000,000 to $1,080,000 over the same periods. The campaign group grows 12%, but the comparison group grows 8%. Reporting the full $120,000 increase as a campaign gain would credit the campaign with growth also seen elsewhere.
The simple difference-in-differences calculation subtracts the comparison group’s $80,000 change from the campaign group’s $120,000 change, leaving $40,000. Because both starting totals are equal here, the difference in growth rates is also four percentage points. With unequal starting totals, subtracting percentage changes would require a separate justification; it is not automatically the same calculation. For Power BI consulting, retain those four input totals alongside the calculation so the user can trace the result.
The World Bank’s discussion of parallel trends explains the assumption behind this method: without the intervention, the groups would have followed comparable changes in the outcome. A store closure nearby, unequal discounting or a stock shortage could undermine that assumption. These aggregate totals alone provide no confidence interval or proof of causation. Treat $40,000 as a worked estimate under stated assumptions, not as an established campaign result.
For a separate unequal-baseline illustration, suppose comparison stores start at $800,000 and finish at $864,000. Applying their 8% growth to the campaign stores’ $1,000,000 baseline gives a $1,080,000 counterfactual and the same $40,000 estimate. Subtracting the comparison group’s $64,000 dollar change instead gives $56,000. The first assumes comparable proportional growth; the second assumes comparable dollar changes. Choose the assumption before the test and justify it from trading history. Indexing both groups to 100 does not, by itself, make the comparison valid.
Check Whether the Additional Sales Pay for the Test
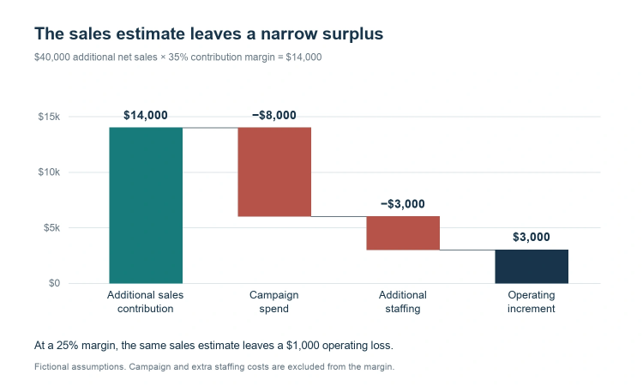
Assume the estimated additional sales earn a 35% contribution margin after merchandise and ordinary variable selling costs. They then contribute $14,000 before campaign-specific costs. Deduct $8,000 of campaign spend and $3,000 of additional event staffing, neither already included in the margin. The remaining operating increment is $3,000. Counting the staffing cost twice would understate that result; omitting it would overstate it.
At the same margin and costs, the campaign needs about $31,429 in additional net sales to break even: $11,000 divided by 35%. That is a conditional threshold, not a forecast. If the margin falls to 25%, $40,000 contributes only $10,000 and the operating increment becomes negative $1,000. The decision is sensitive to the margin actually earned on the additional purchases. For data visualization consulting, make the margin assumption as visible as the sales estimate.
The comparison assumption also matters commercially. Holding the original equal baselines, campaign sales and 35% margin fixed, suppose comparison growth had been 9% rather than 8%. Its $90,000 increase would leave a $30,000 sales estimate and an operating loss of $500 after the same $11,000 costs. A one-percentage-point change in background growth turns the estimated surplus into a loss. Investigate that uncertainty before committing the rollout budget.
Use the actual product mix rather than the chain’s headline gross margin. A related guide to multi-store profitability shows why cost definitions matter when comparing locations. A positive operating increment for this test still does not establish the return from a larger rollout, whose media, staffing and production costs may differ.
Make the Evidence Useful in the Trading Meeting
The trading meeting needs both the campaign comparison and the individual store records. A strong total can conceal a result driven by one location or by changes in opening hours. Keep the comparison separate from a routine sales ranking, and explain data corrections rather than quietly replacing the original test.
Decide What Evidence the Rollout Still Needs
Linden Lane’s next step is to investigate whether the comparison is credible and whether the 35% margin holds. It should also check for purchases brought forward from later weeks and sales shifted from nearby stores. A short test cannot establish durable brand preference, so later customer research and repeat-purchase evidence should be considered separately.
For this illustrative pilot, agree a further four-week follow-up for both groups and examine the combined campaign-plus-follow-up result. A later relative shortfall could offset the initial gain. Choose the actual follow-up duration to reflect the products’ buying cycle, and record concurrent promotions or stock changes. Include nearby stores when checking shifted sales. This provides a practical check on timing and location effects without treating a short window as proof of lasting brand preference.
For a smaller retailer, data analytics consulting for small businesses can begin with reconciled sales, a documented campaign calendar and explicit costs. Limited data may justify a cautious pilot rather than a complex model. Expand only when the evidence supports the expected contribution and the uncertainty is acceptable to the people funding the campaign.
About the Author
Basem Fawzy is the founder of Data Pivot Consulting. He is a Microsoft Certified Power BI Developer and MBA graduate in E-Business with more than 10 years of experience in business intelligence, data modeling, dashboard development and reporting automation. He has worked with more than 200 clients and regularly translates operational data into management-level reporting frameworks.
To explore more content like this, follow The Brand Hopper
Subscribe to our newsletter